Hey, I bet you wanted to cluster a population sometime, you know, like taking data of a population and to divide it into groups, where in each group the individuals inside the group are similar to each other more than to any other individuals from other groups. That’s one of the most common problems facing business sectors in our current day and age. For example, imagine a marketing company that wants to divide their entire audience into a group of separated audiences, where you can say something about each group that you can say less about the other groups, something which is more of a characteristic of the group then of other groups. this action is called segmentation, because ultimately what you do is to divide the population into segments. Just as a side note; the term segmentation could be used for other purposes in machine learning (ML), like in computer vision, where it means something more relevant to image processing, where the machine groups common pixels to the same group, be aware of that when you hear this term, try to understand in which context it’s been used.
In this article we are going to cover a problem I’ve encountered in one of the projects I’m leading, while trying to do segmentation of users that enters the business, for grouping them into behavioral groups. we used crisp-dm model as our machine learning pipeline, this model pipeline was very appropriate to problem, it’s evolves around the data with business knowledge of the problem, understanding what the data of the users we will use, the data preparation, which we will dive deeper into, and using an Unsupervised machine learning clustering model such as k-means, and evaluating and analyzing the results of the segmentation, and finally use it in the company’s websites, for the goal of increasing the user experience.
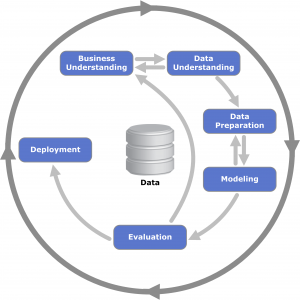
crisp – dm diagram
We will focused on our main challenge we encountered which was how we should represent our data, not only in a technical way (which we must follow to solve the problem using statistics), but also in a way which is still keeps the information which is in the data. This was quite a challenge because we had mixed data types, some of the features we used where quantitative – continues or discrete, qualitative – nominal or ordinal. In order to use a clustering model such as the classic K-means model, which uses distances functions like Euclidean distance, as part of it’s iterative process. Because of this characteristic of the k-means model, which we wanted to use as a benchmark, we needed to find a way to deal with our mixed data. because of the lack of business meaning of the mathematical distance of let’s say city feature. Let’s look at 3 cities: Jerusalem, Tel-Aviv and Ashdod, and let’s label them this way: Jerusalem – 1, Tel – Aviv – 2, Ashdod – 3. What is the meaning of 3 for Ashdod compared to 1 for Jerusalem?! Is Ashdod 3 times the city of Jerusalem? This is problematic, and like any problem regarding the use of data, we solved it.
We used Factor Analysis of Mixed Data (FAMD) which is a statistical tool that its main use is for transforming the data into a domain with new dimensions that could have less dimensions than the original problem, for the purpose of extracting the main features that explains the whole data. A classic factor analysis you might be familiar with is: Principal component analysis (PCA), which is a form of factor analysis (FA) that is quite used in the ML world, mainly for dimension reduction. For our problem PCA would not work well, because PCA is better for problems with only quantitative features. The FAMD is doing PCA but adds to it another type of FA which is called: multiple correspondence analysis (MCA) which is used for qualitative variables, so we couldn’t use this as well (Brigitte & Jérôme 2008).
Let’s formalize FAMD. We split the data into two groups of features. We denote the letter Q to represent the group of the qualitative features q = 1,…, Q and the group K to represent the quantitative features k = 1,…, K. we note:
![]() = the correlation coefficient between variables z and k.
= the correlation coefficient between variables z and k.
![]() = the squared correlation coefficient between variables z and q.
= the squared correlation coefficient between variables z and q.
Now we could use PCA (group Q) and MCA (group K), but in a way which works together:
In the PCA of K, we look for the function that maximize the correlation between the variables z and k and turn the data to eigen vectors with respect to the variance of the features, to find the components representing the PCA transformation.
![]() In the MCA of Q, we look for the function that maximize the correlation between the variables z and k for each value in category q with samples of z and find the components that best represent the variance according the quantitative variables.
In the MCA of Q, we look for the function that maximize the correlation between the variables z and k for each value in category q with samples of z and find the components that best represent the variance according the quantitative variables.
![]()
Now we look for the function that is more related to all K+Q variables in the following sense:
![]()
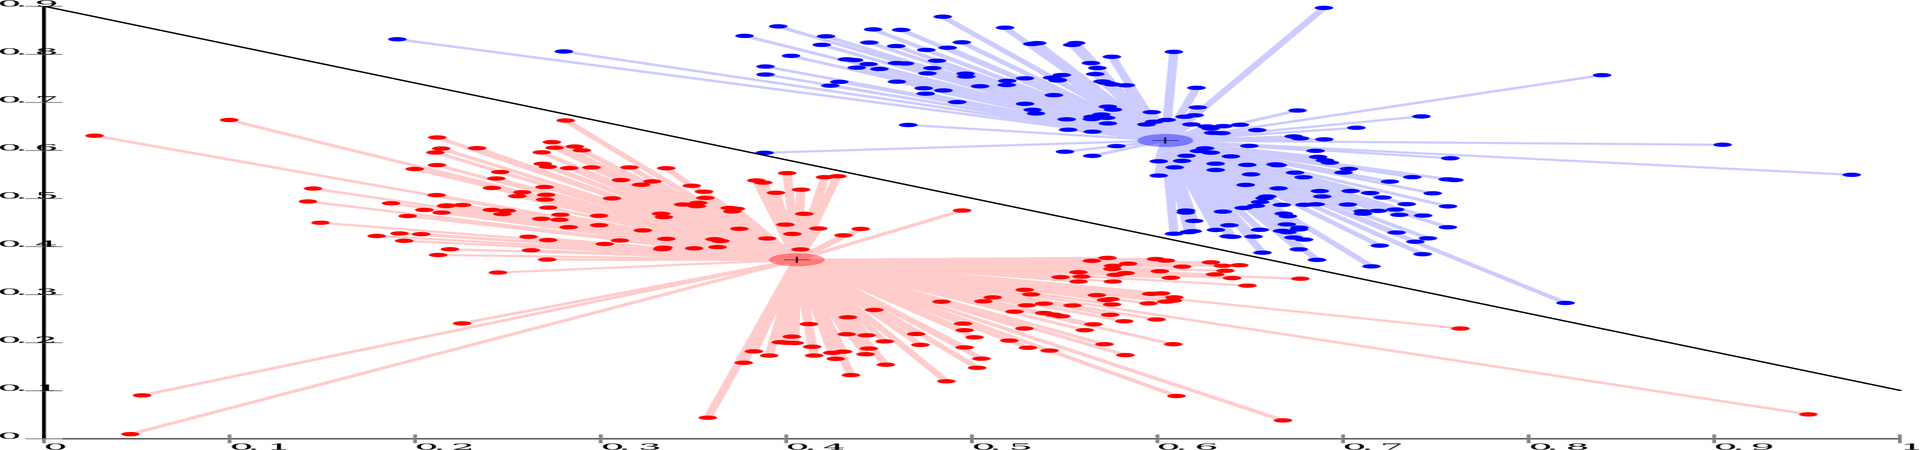
This means that we find components based on the variance of the problem that treats quantitative and qualitative variables the same way and transforms them to continuous features. This breakthrough in the data representation help us to achieve our goal to and to create the segmentation we longed for. and to use k-means to cluster the data into segments of interest in a way that meats our business goals.
reference: Escofier Brigitte & Pagès Jérôme (2008). Analyses factorielles simples et multiples. Dunod. Paris. 318 p. p. 27 et seq.